パーティクルベースで6DoFの姿勢推定をするMega Particlesを読むために、前提となっているStein Variational Gradient Descent (SVGD) を調べる。細部については全然理解できていないが、ざっくりとした理解を記す。間違いがある可能性もかなり高いので、気になる場合は各自で元論文などを参照すること。
参考にしたページ
- 元論文
- わかりやすく、式変形も詳細な日本語解説スライド
- 実装例があり参考になる日本語解説ブログ
応用までの概観
Mega Particlesへの応用が見えるような理屈の流れを概観する。Stein Operatorから出発する方が自然なのだろうが、応用という観点で考えたときの視点でいくらか逆行するかのような順番にしている。
ベイズ推論で事後確率を計算する一つの手段として、変分推論ではKLダイバージェンスを最小化することで近似的に事後確率を求める。SVGDは変分推論の一つであり、パーティクル集合として分布を近似し、勾配降下法でパーティクル分布を更新することで変分推論を行う。
パーティクルをちょっとずつ更新していく操作を考える。いくらかの条件を満たした関数 と
を小さい値として
という摂動で更新する。
,
である
において
の勾配が最も大きいような を考えてその変換を使って勾配降下していきたい。
ここで突然だが、分布 と一定の制約を満たす関数
についてStein Operator
というものを考えると、先の勾配について
という関係が得られる。(このあたりの種々の関係が面白そうなので論文等を追うと良さそう。)よって右辺のマイナスを取り払ったものが最大になればいい。 をいろいろ考えて、最大の場合の値をStein Discrepancyという。
特に関数 に与える制約を再生核ヒルベルト空間というものに限定した場合に、Stein Discrepancyは
としてRBFカーネルのように滑らかかつ正定値性を満たすカーネル関数を用いた場合になることが示せる。
( として再生核ヒルベルト空間を考えれば十分であるという理屈は理解できていない。これは実性能との兼ね合いということにもなる?)
なので、最終的なアルゴリズムはかなり簡単になり、
- 入力 : 確率密度関数が
である目標分布と、初期パーティクル集合
、カーネル関数
- 出力 : 目標分布を近似するパーティクル集合
- 各イテレーション
において、ステップサイズを
としてパーティクルを以下のように更新する。
重要なところは、目標分布 については
が計算できれば十分ということである。Mega ParticlesではGICP (Generalized Iterative Closest Point) を使って対数尤度関数の勾配を計算している。
実装
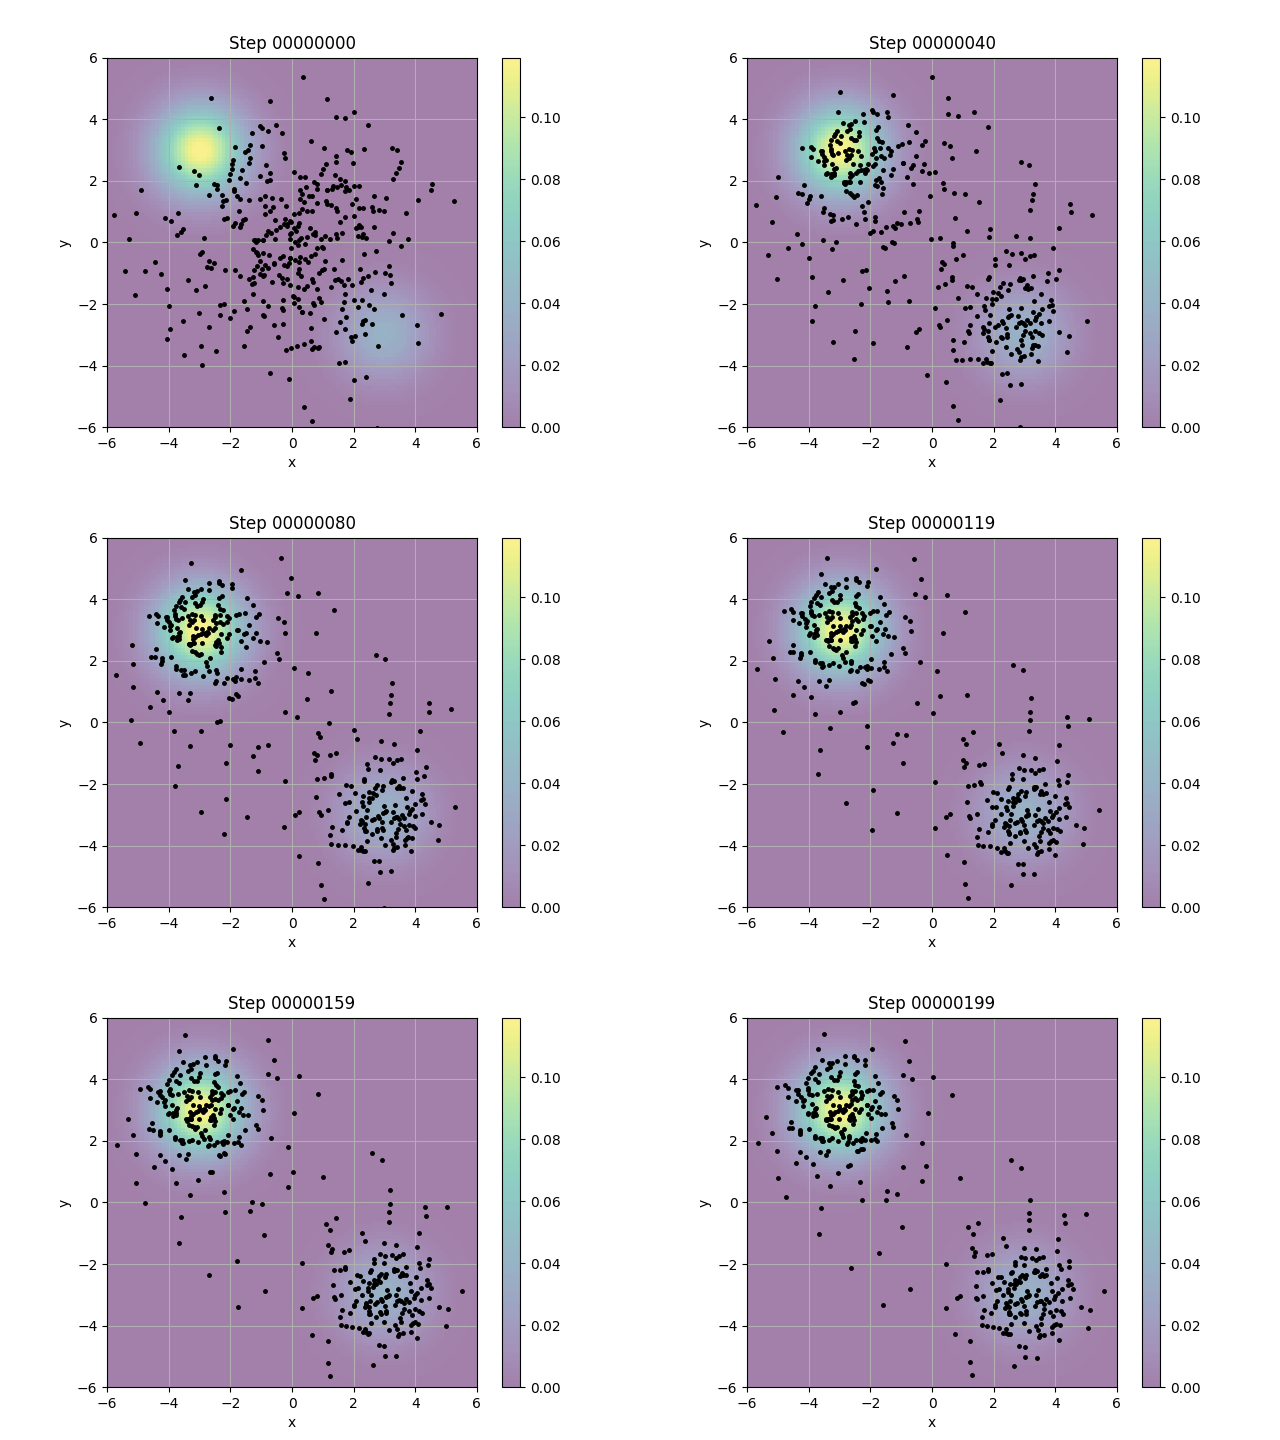
冒頭で示したブログ記事を参考にして、自分でも2Dでの多次元ガウス分布に対してパーティクル分布をフィッティングさせるPythonコードを書いた。元のコードでは確率密度関数やカーネルの微分のためにtensorflowを使っているようだったが、そのあたりも手計算でnumpyで書いた。そのためなにか実装ミスがある可能性も残っている。
結果は以下の通り。

概ねそれっぽい挙動にはなっているが、左上と右下のガウス分布で重みが違うわりには点の量にはそこまで差がないところは気にかかる。重みを上手く考慮できていないのではないかとしばらくコードを眺めていたが、わからなかった。
コード
gaussian_mixture_model.py
import numpy as np


def gaussian_pdf(x, mu, cov, precision):
    """
    ガウス分布の確率密度関数を計算する
    x: 入力データ shape=(n,)
    mu: 平均ベクトル shape=(n,)
    cov: 共分散行列 shape=(n, n)
    precision: 精度行列 shape=(n, n)

    return: 確率密度 shape=(1,)
    """
    n = x.shape[0]
    diff = x - mu
    a = -0.5 * diff.T @ precision @ diff
    b = 1 / np.sqrt((2 * np.pi) ** n * np.linalg.det(cov))
    return b * np.exp(a)


def log_prob_grad(x, means, covs, weights):
    """
    混合ガウス分布の対数確率密度関数の勾配を計算する
    x: 入力データ shape=(n,)
    means: 平均ベクトル shape=(K, n)
    covs: 共分散行列 shape=(K, n, n)
    weights: 混合係数 shape=(K,)

    return: 勾配 shape=(n,)
    """
    K = len(weights)
    n = x.shape[0]

    # 各混合要素の精度行列と精度行列と平均ベクトルの積を計算
    # Λ_k = Σ_k^(-1)
    # Λ_k * (x - μ_k)
    precision_array = [np.linalg.inv(covs[k]) for k in range(K)]
    precision_mean_diff_array = [precision_array[k] @ (x - means[k]) for k in range(K)]

    # 各混合要素の確率密度を計算
    # p(x|μ_k,Σ_k) = N(x|μ_k,Σ_k)
    pdf_array = np.array(
        [gaussian_pdf(x, means[k], covs[k], precision_array[k]) for k in range(K)]
    )

    # 混合ガウス分布の確率密度を計算
    # p(x) = Σ_k π_k * p(x|μ_k,Σ_k)
    mix_pdf = np.sum(weights * pdf_array)

    # 勾配を計算
    # ∇_x log p(x) = (Σ_k -π_k * p(x|μ_k,Σ_k) * Λ_k * (x - μ_k)) / p(x)
    grad = np.zeros(n)
    for k in range(K):
        grad += -weights[k] * pdf_array[k] * precision_mean_diff_array[k]
    grad /= mix_pdf

    return grad
main.py
import numpy as np
from gaussian_mixture_model import log_prob_grad
from tqdm import tqdm
from pathlib import Path
import pandas as pd
from shutil import rmtree


def get_svgd_kernel(X):
    """
    X: shape=(num_particles, dim)

    return:
      * kernel_matrix: shape=(num_particles, num_particles)
      * h: scalar
    """
    X_dot = X @ X.T  # shape=(num_particles, num_particles)

    X_norm = np.sum(np.square(X), axis=1)  # shape=(num_particles,)

    X_norm = np.reshape(X_norm, (X.shape[0], 1))  # shape=(num_particles, 1)

    X2e = np.tile(X_norm, (1, X.shape[0]))  # shape=(num_particles, num_particles)

    H = X2e + X2e.T - 2 * X_dot  # shape=(num_particles, num_particles)

    V = np.reshape(H, (-1, 1))  # shape=(num_particles * num_particles, 1)

    # median distance
    h = np.median(V)  # scalar
    h = np.sqrt(0.5 * h / np.log(X.shape[0] + 1.0))  # scalar

    kernel_matrix = np.exp(-H / h**2 / 2.0)  # shape=(num_particles, num_particles)

    return kernel_matrix, h


def get_phi(samples, ln_prob_func, num_particles, dim):
    """
    samples: shape=(num_particles, dim)
    ln_prob_func: function
    num_particles: int
    dim: int

    return: shape=(num_particles, dim)
    """
    kernel_matrix, h = get_svgd_kernel(samples)  # shape=(num_particles, num_particles)

    # get log-probability gradients
    log_prob_grads = np.zeros_like(samples)  # shape=(num_particles, dim)
    kernel_grad = np.zeros_like(samples)
    for i in range(num_particles):
        log_prob_grads[i] = ln_prob_func(samples[i])
        diff = samples[i] - samples  # shape=(num_particles, dim)
        diff_sum = kernel_matrix[i] @ diff
        diff_sum = np.reshape(diff_sum, (dim))
        kernel_grad[i] = diff_sum / h**2

    operation = kernel_matrix @ log_prob_grads + kernel_grad
    operation = np.reshape(operation, (num_particles, dim))

    return operation / num_particles


if __name__ == "__main__":
    eps = 0.2
    num_particles = 400
    num_iter = 200
    dim = 2

    means = np.array([[-3.0, +3.0], [+3.0, -3.0]])
    covs = np.array([np.eye(2), np.eye(2)])
    weights = np.array([0.75, 0.25])

    def gmm_log_prob(x):
        return log_prob_grad(x, means, covs, weights)

    q_init_mean = np.array([0.0, 0.0])
    q_init_cov = np.array([[4.0, 0.0], [0.0, 4.0]])
    samples = np.random.multivariate_normal(q_init_mean, q_init_cov, size=num_particles)

    all_samples = []

    save_dir = Path("./svgd_result")
    rmtree(save_dir, ignore_errors=True)
    save_dir.mkdir(exist_ok=True)

    for i in tqdm(range(num_iter)):
        grads = get_phi(samples, gmm_log_prob, num_particles, dim)
        samples = samples + eps * grads
        df = pd.DataFrame(samples, columns=["x", "y"])
        df.to_csv(save_dir / f"{i:08d}.csv", index=False)
plot.py
import matplotlib.pyplot as plt
import numpy as np
from gaussian_mixture_model import log_prob_grad, gaussian_pdf
from tqdm import tqdm
from pathlib import Path
import pandas as pd
from shutil import rmtree


if __name__ == "__main__":
    means = np.array([[-3.0, +3.0], [+3.0, -3.0]])
    covs = np.array([np.eye(2), np.eye(2)])
    precisions = np.linalg.inv(covs)
    weights = np.array([0.75, 0.25])

    csv_dir = Path("./svgd_result")
    csv_files = sorted(csv_dir.glob("*.csv"))
    save_dir = Path("./svgd_result_png")
    rmtree(save_dir, ignore_errors=True)
    save_dir.mkdir(exist_ok=True)
    MIN_XY = -6
    MAX_XY = +6

    # 各地点の密度を計算
    x = np.linspace(MIN_XY, MAX_XY, 100)
    y = np.linspace(MIN_XY, MAX_XY, 100)
    X, Y = np.meshgrid(x, y)  # shape=(100, 100)
    X = X.ravel()  # shape=(10000,)
    Y = Y.ravel()  # shape=(10000,)
    positions = np.vstack([X, Y])  # shape=(2, 10000)
    Z = np.zeros_like(X)
    for i, position in enumerate(positions.T):
        for mean, cov, precision, weight in zip(means, covs, precisions, weights):
            Z[i] += weight * gaussian_pdf(position, mean, cov, precision)
    X = X.reshape(100, 100)
    Y = Y.reshape(100, 100)
    Z = Z.reshape(100, 100)

    for csv_file in tqdm(csv_files):
        # plot gauss
        plt.imshow(
            Z,
            extent=(MIN_XY, MAX_XY, MIN_XY, MAX_XY),
            origin="lower",
            cmap="viridis",
            alpha=0.5,
        )
        plt.colorbar()

        # plot samples
        df = pd.read_csv(csv_file)
        plt.plot(df["x"], df["y"], "o", color="black", markersize=2.5)
        plt.grid()
        plt.xlabel("x")
        plt.ylabel("y")
        plt.xlim(MIN_XY, MAX_XY)
        plt.ylim(MIN_XY, MAX_XY)
        plt.title(f"Step {csv_file.stem}")
        plt.savefig(save_dir / f"{csv_file.stem}.png")
        plt.close()